Assignment 2
Due Monday 11th November 2024 at noon in Gradescope
Background
Below is a top down view of a wind turbine, with wind depicted by an arrow with wind speed \(w\), at angle of incidence \(\gamma\). Assume the turbine is static (does not move orientation), that \(\gamma \in (-90^{\circ}, 90^{\circ})\), and that realisations of vector \((w, \gamma)\) are statistically independent and identically distributed across days.
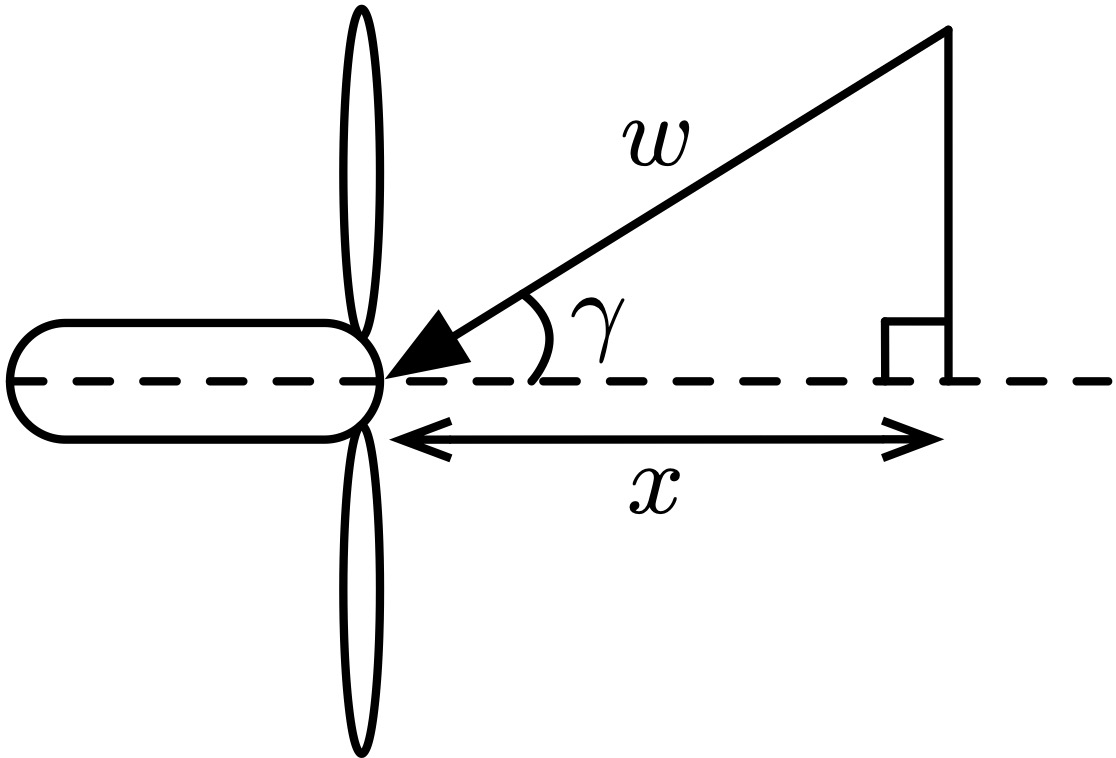
Only the component of wind perpendicular to the turbine contributes to power generation, shown as \(x\) above. However, wind turbines cannot extract power for all values of \(x\): there is a minimum required to turn the rotor and a maximum above which no extra power can be extracted. The so-called ‘power curve’, which we denote \(V(x)\), specifies the power extractable from component \(x\) in kilowatts (kW). We consider the following toy version of a power curve: \[ V(x) = \begin{cases} 0 & \mbox{for } x \in [0,1) \\ 200x-200 & \mbox{for } x \in [1,12) \\ 2200 & \mbox{for } x \in [12, \infty) \end{cases} \]
Question
You are approached by a power company who are interested in estimating the mean power generation rate (kW) across days. They have collected four days of wind speed and angle of incidence data, \(\big((w_1,\gamma_1),\dots,(w_4,\gamma_4)\big)\), as follows:
| Day \(i\) | \(w_i\) (m/s) | \(\gamma_i\) (\(^{\circ}\)) |
|---|---|---|
| 1 | 6.9 | -54 |
| 2 | 6.0 | 72 |
| 3 | 4.5 | 80 |
| 4 | 1.9 | 29 |
NOTE: this is an unrealistically small data set for this kind of problem, but this is so that we can work with it easily with pen and paper. In practice, more data would be used to achieve more accurate estimators.
Write down the formula to compute \(x_i\) given \((w_i, \gamma_i)\) for day \(i\). Hence, or otherwise, write down a formula for the statistic \(S(\mathbf{w},\boldsymbol{\gamma})\) which computes the mean wind power generation rate, given vectors of wind speed and angle of incidence for \(n\) days, \(\mathbf{w} = (w_1, \dots, w_n), \boldsymbol{\gamma} = (\gamma_1, \dots, \gamma_n)\).
Compute the mean power generation rate, \(S(\mathbf{w}^\star,\boldsymbol{\gamma}^\star)\), for the bootstrap resample: \[(\mathbf{w}^\star,\boldsymbol{\gamma}^\star) = \big((w_2,\gamma_2),(w_3,\gamma_3),(w_1,\gamma_1),(w_2,\gamma_2)\big)\] Also, what is the largest value \(S(\mathbf{w}^\star,\boldsymbol{\gamma}^\star)\) could take for any possible bootstrap resample?
NOTE/HINT: resampling is done for days, since there is some unknown joint distribution for \((w_i, \gamma_i)\) … hence the same index must always apply to the individual resamples of wind and angle or else the joint distribution is violated (eg \((w_2, \gamma_2)\) is valid, but \((w_2, \gamma_4)\) is not valid)
Bootstrap simulation for the data above gives \(\bar{S}^\star = 228.56\) and \(\widehat{\text{Var}}\big(S(\mathbf{w}, \boldsymbol{\gamma})\big) = 13350\). Compute the 95% Normal confidence interval (CI) and comment on whether you consider there to be any appreciable bias in the mean estimator.
Following are sorted bootstrapped values for \(S(\mathbf{w}^\star,\boldsymbol{\gamma}^\star)\) and how often they occured (‘Freq’). The total number of bootstrap replicates (sum of ‘Freq’) is \(B=1000\). Find a 95% CI for the mean power generation rate by the percentile method. Comment on the resulting CI compared to the Normal interval.
| \(S(\mathbf{w}^\star,\boldsymbol{\gamma}^\star)\) | Freq | \(\qquad\) | \(S(\mathbf{w}^\star,\boldsymbol{\gamma}^\star)\) | Freq |
|---|---|---|---|---|
| 0 | 5 | \(\vdots\) | \(\vdots\) | |
| 33.1 | 15 | 381.4 | 58 | |
| 42.7 | 21 | 391.0 | 22 | |
| 66.2 | 18 | 458.4 | 8 | |
| 75.8 | 50 | 491.4 | 16 | |
| 85.4 | 17 | 501.1 | 14 | |
| \(\vdots\) | \(\vdots\) | 611.1 | 3 |
The power company believe that the component \(x\), which contributes to power generation, can be directly modelled as Exponential, with parameter \(\lambda\) depending on conditions near the turbine: \[ \mbox{Exponential pdf:} \qquad f(x \,|\, \lambda) = \lambda e^{-\lambda x}, \quad x \in [0, \infty), \lambda>0 \] In other words, with the Exponential distribution as a model for \(x_i\), we can simulate it directly, without simulating \((w_i, \gamma_i)\).
Making this assumption, list the detailed steps to perform a parametric bootstrap estimate of the uncertainty in the mean power generation rate (kW) (‘detailed’ means you should include any derivations of, for example, maximum likelihood estimators or any other quantities needed to do parametric bootstrap)
Code up your detailed steps from Q5 in R and use \(B=10,000\) parametric bootstrap replicates to estimate \(\widehat{\text{Var}}\big(S(\cdot)\big)\). You may find the function
rexp()useful (see help file). Provide both the R code as well as the estimate of \(\widehat{\text{Var}}\big(S(\cdot)\big)\) it produces in your answer (do not list all 10000 simulations!!)NOTE: Do not worry, the solutions used for marking will allow a range of values in the answer for \(\widehat{\text{Var}}\big(S(\cdot)\big)\) to allow for variability due to the random simulation.
🏁🏁 Done, end of assignment! 🏁🏁