B Data Sets
B.1 Palmer penguins

A dataset containing various size measurements and other covariates on 344 penguins of 3 different species, collected at Palmer Station in Antarctica (Gorman et al., 2014).
The data is conveniently available in the palmerpenguins R package (Horst et al., 2020), which is available from CRAN:
Details of the data (reproduced from Horst et al., 2020):
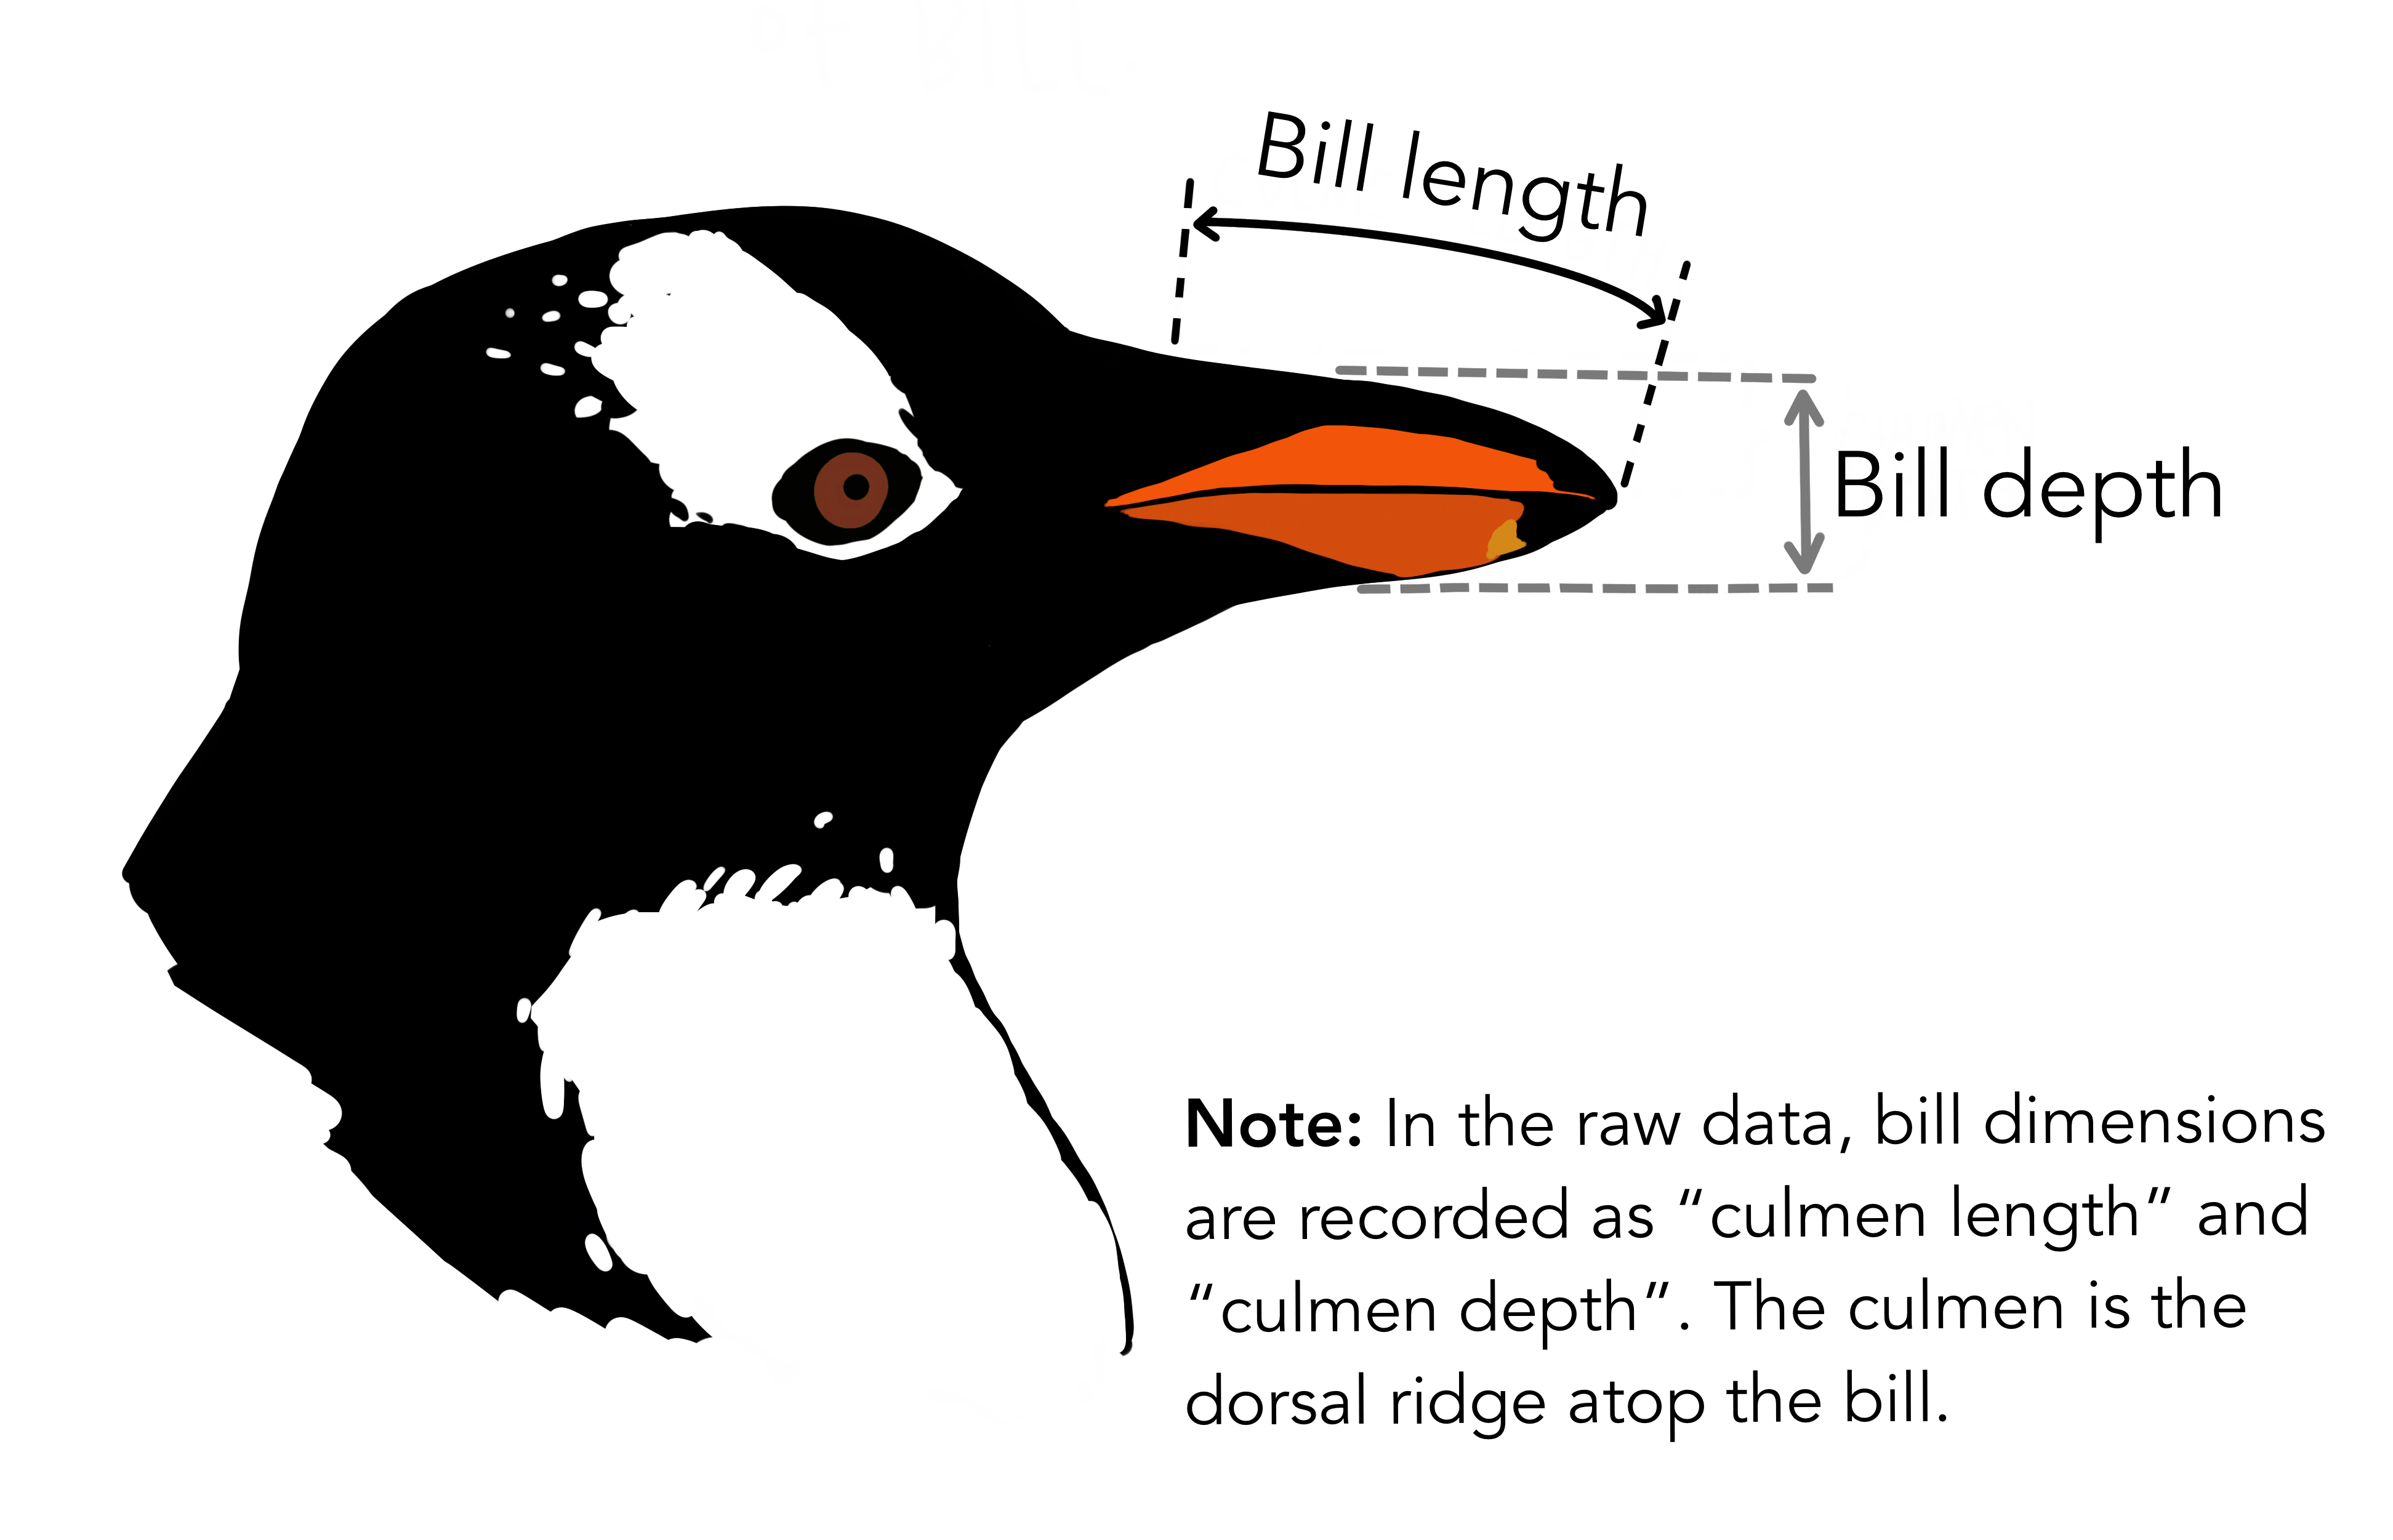
species: a factor denoting penguin species (Adélie, Chinstrap and Gentoo)island: a factor denoting island in Palmer Archipelago, Antarctica (Biscoe, Dream or Torgersen)bill_length_mm: a number denoting bill length (millimeters)bill_depth_mm: a number denoting bill depth (millimeters)flipper_length_mm: an integer denoting flipper length (millimeters)body_mass_g: an integer denoting body mass (grams)sex: a factor denoting penguin sex (female, male)year: an integer denoting the study year (2007, 2008, or 2009)

B.1.1 Penguin species prediction colouring
For all the examples using this dataset in the course we will represent the predictive probability (at the centre of a hexagonal covering of the plane) by a colour derived from Maxwell’s Triangle (Maxwell, 1860).

This triangle provides a continuous colour spectrum on the standard 2-simplex (ie probability vector of length 3 summing to 1). For example, a predictive probability of \(\frac{1}{3}\) for all species is falls in the very centre of the triangle and is represented by white; a probability of 0.5 each for Chinstrap and Adélie with 0.0 for Gentoo lies on the left vertical edge and is bright yellow; a certainty for Gentoo is in the bottom right corner and is blue; etc etc.