A Coding Data for ML
This is a brief appendix for anyone who may be unfamiliar with representation of different data types for modelling. It can be safely skipped by anyone who is comfortable with representation of data in tabular form for modelling.
Recall, statistical and machine learning methodology is often predicated on the basis that our features are \(\mathcal{X} \subset \mathbb{R}^d\). Therefore, we usually represent a full dataset as an \(n \times d\) matrix representation of features: \[ \mathbf{X} = (\mathbf{x}_{\cdot 1}, \dots, \mathbf{x}_{\cdot d}) = \begin{pmatrix} x_{11} & x_{12} & \cdots & x_{1d} \\ x_{21} & x_{22} & \cdots & x_{2d} \\ \vdots & \vdots & \ddots & \vdots \\ x_{n1} & x_{n2} & \cdots & x_{nd} \end{pmatrix} \]
Rows gives feature values for a particular observation/individual. Columns represent all the observations on a particular feature.
But, our data can arise in many forms:
- numeric (eg person’s height \(\in \mathbb{R}^+\))
- categorical (eg person’s eye colour \(\in \{ \text{green}, \text{blue}, \dots, \text{brown} \}\))
- image (eg of person’s face \(\in \{ x \in \mathbb{Z} : 0 \le x \le 255 \}^{l \times m}\))
- video (eg \(\in \{ x \in \mathbb{Z} : 0 \le x \le 255 \}^{l \times m \times t}\))
- text (eg “It is a truth universally acknowledged, that a single man in possession of a good fortune, must be in want of a wife. …”, Jane Austen, Pride and Prejudice)
- other
All these inputs must in principle be transformed into an \(n \times d\) numeric matrix representation.
Let the data contain \(j^\text{th}\) input feature \(\tilde{\mathbf{x}}_{\cdot j}\), so that observation \(i\) is \(\tilde{x}_{ij}\). The tilde notation here just means before representation in matrix form.
Numeric data
If \(\tilde{x}_{ij}\) is numeric already (ie possible values \(\subseteq \mathbb{R}\)), we may copy the value straight into the matrix representation:
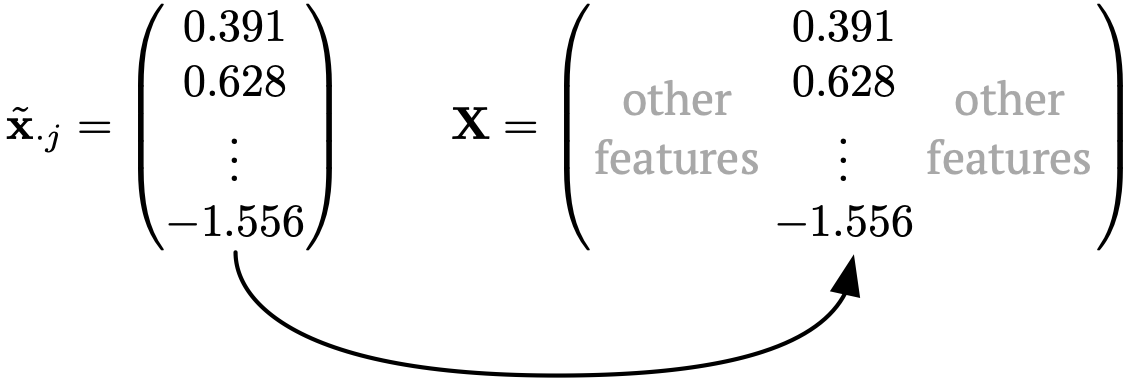
Sometimes, we may copy in a rescaling \(\tilde{x}_{ij} \to \frac{\tilde{x}_{ij} - \hat\mu_j}{\hat\sigma_j}\) (especially for \(k\)-nearest neighbour, deep learning, etc).
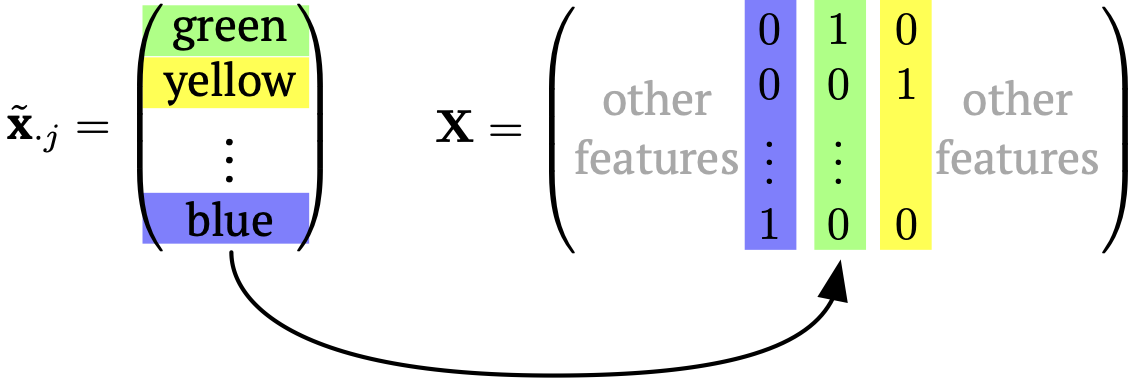
Categorical data
In the categorical case, \[ \tilde{x}_{ij} \in \{ \text{catg } 1, \text{catg } 2, \dots, \text{catg } m \} \] To represent this in a numeric matrix form, usually three choices.
1. One-hot coding: create \(m\) columns in \(\mathbf{X}\) for this new feature with a straight binary encoding.
For example, let \(\tilde{x}_{ij} \in \{ \text{blue}, \text{green}, \text{yellow} \}\). Then,
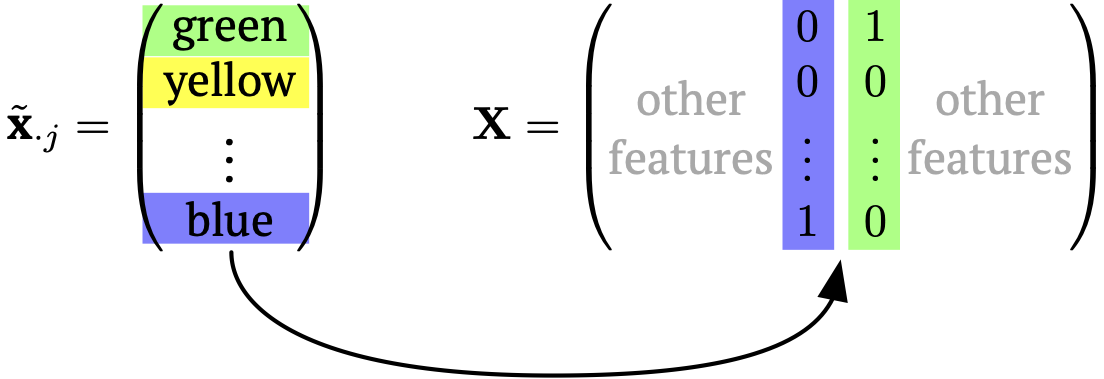
2. Dummy coding: create \(m-1\) columns in \(\mathbf{X}\) for this new feature with a binary encoding, where one of the categories is implied by a zero everywhere.
Again, for \(\tilde{x}_{ij} \in \{ \text{blue}, \text{green}, \text{yellow} \}\). Then,
These two are the preferred coding style, which will depend on the model used.
3. Ordinal coding: create 1 column in \(\mathbf{X}\) for this new feature with an integer encoding for each possible category.
Now for \(\tilde{x}_{ij} \in \{ \text{medium}, \text{small}, \text{large} \}\). Then,
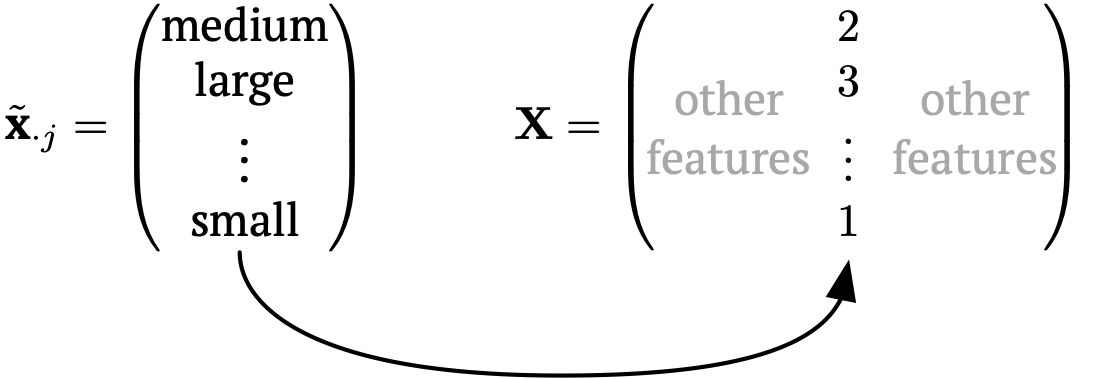
This coding style is used less due to the implied ordering and, in linear models, the implied constant effect between categories.
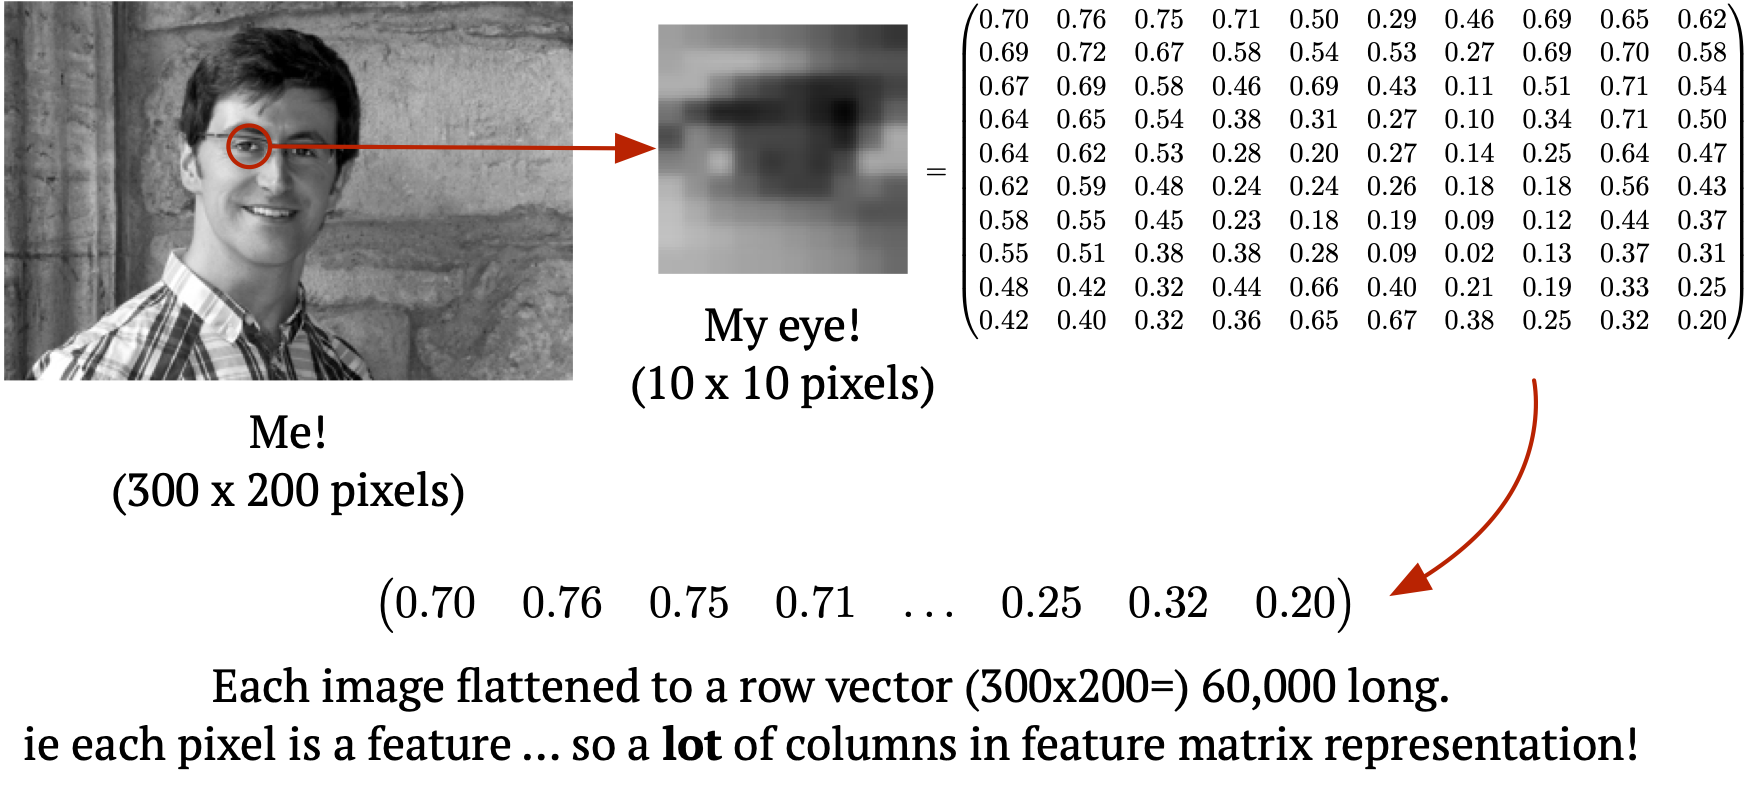
Image data
Consider grey-scale images (each image an observation).
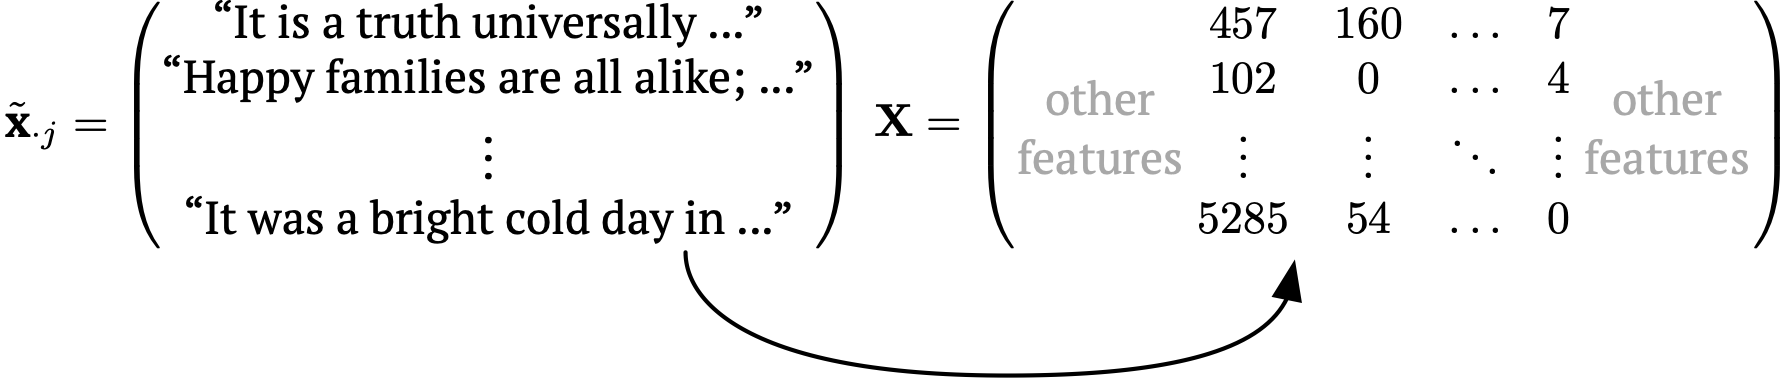
Text data
Each element of the input \(\tilde{\mathbf{x}}_{\cdot j}\) is usually called a document, not an observation.
A document term matrix is the most common encoding, assigning each word to a column containing counts, usually after removing common words (‘stop words’) such as ‘the’, ‘and’, ‘a’, etc.
Also possibly \(n\)-grams. See https://www.tidytextmining.com/
Other data types
- Video
- Sound
- Time series
- Sensors (eg accelerometer, LiDAR, …)
Note that this all applies to coding the response too!
Thus, response most often a numeric vector (or \(n \times 1\) matrix), though can be numeric matrix/tensor in deep learning.