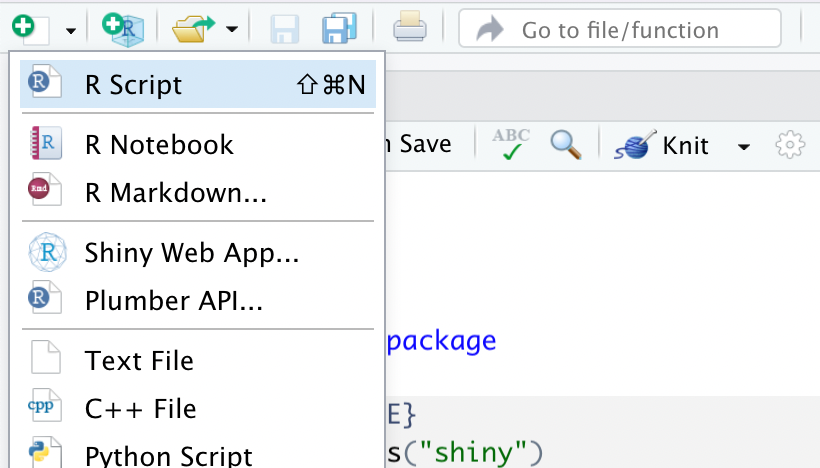
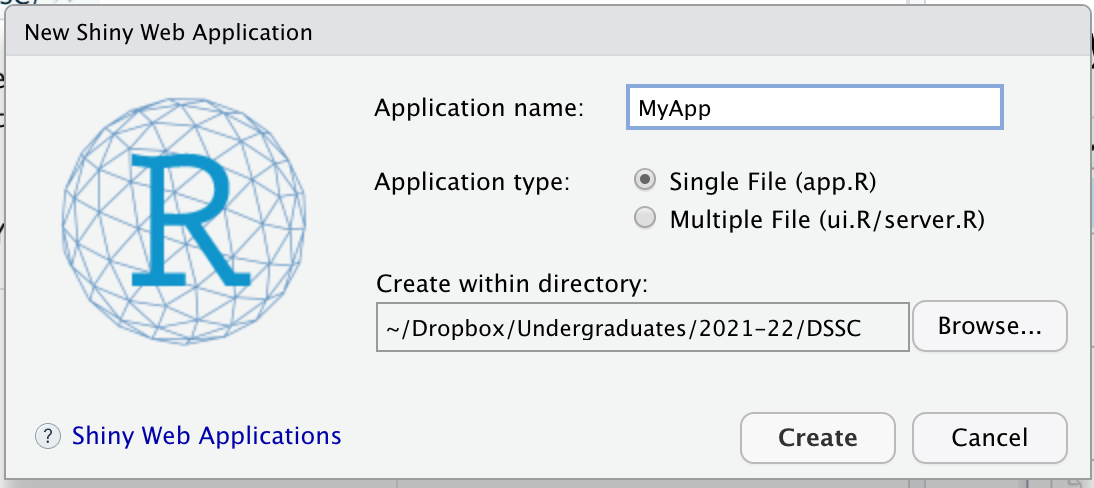
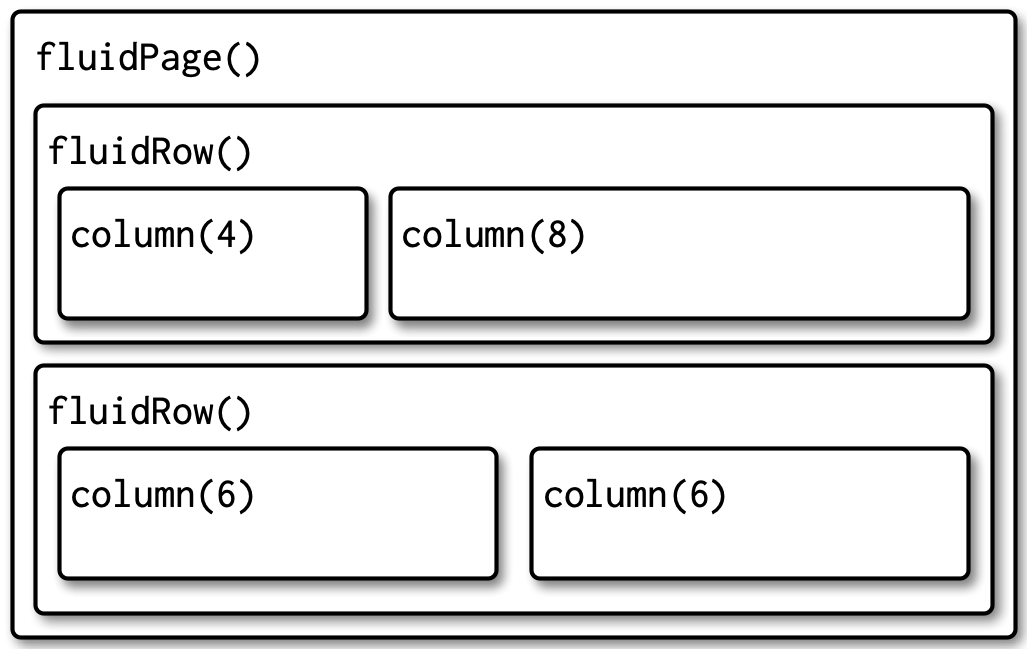
class: center, middle, inverse, title-slide .title[ # Data Science and Statistical Computing ] .subtitle[ ## Practical Lecture 8<br>Interactive Dashboards ] .author[ ### Dr Louis Aslett ] .institute[ ### Durham University ] .date[ ### 28 November 2024 ] --- <style type="text/css"> .remark-slide-content { font-size: 125% !important; } .smaller .remark-code { /*Change made here*/ font-size: 70% !important; } </style> ## Interactive Dashboards? - Presents data in a way the viewer can explore themselves - Compact display: allow the user to select the view they want, rather than providing reams of all possible graphics - Enables "self-service" ... keeps you (the data scientist) freer to work on analyses - Dashboards are standard HTML and Javascript - can be viewed by anyone (with or without R) if uploaded to a web server - can be viewed locally if they have R - Can be embedded in RMarkdown to add interactivity to your dynamic documents - Shiny was invented by the R community, but has now been ported to Python too - a bit like RMarkdown was invented in the R community and now a language agnostic port is nearly complete in Quarto --- class: inverse ## Getting the package ``` r install.packages("shiny") ``` --- ## Shiny It's all just plain text files (yay!). RStudio will again help us by setting up a template as with RMarkdown.  --- ## Shiny Each Shiny application has to be in its own folder. Single/Multiple file is (almost) same code, just different organisation.  --- ## Shiny Two parts to every app: ### UI Defines how your interactive app looks - Titles, headings, explanatory text - Dropdown lists, checkboxes, inputs etc - Code output, tables, graphics, etc ### Server Defines how to update and react to use changes to the UI. - Read input values - Redraw graphics and tables - Refit models, etc --- ## Getting started: UI ``` r # Define UI for application that draws a histogram ui <- fluidPage( # Application title titlePanel("Old Faithful Geyser Data"), # Sidebar with a slider input for number of bins sidebarLayout( sidebarPanel( sliderInput("bins", "Number of bins:", min = 1, max = 50, value = 30) ), # Show a plot of the generated distribution mainPanel( plotOutput("distPlot") ) ) ) ``` --- ## Getting started: UI Easy to miss, but `fluidPage()` is one big function call! Here with 2 arguments: - result of `titlePanel()` call - result of `sidebarLayout()` call -- The `sidebarLayout()` call is *itself* one big function call! Here with 2 arguments also: - result of `sidebarPanel()` - result of `mainPanel()` -- In general, lots of nested function calls define the *layout* of the UI. **Note:** make liberal use of whitespace to make it readable! ... This is the same code 😱 `ui <- fluidPage(titlePanel("Old Faithful Geyser Data"), sidebarLayout(sidebarPanel(sliderInput("bins", "Number of bins:", min = 1, max = 50, value = 30)), mainPanel(plotOutput("distPlot"))))` --- class: inverse ## 🐇 Slow down! 🐢 Run the Shiny app provided to see what happens, but then we'll slow things down and run some super simple examples. <br> All the examples assume you have `library("shiny")` at the top of the script! (omitted to save space) <br> Throughout learning Shiny, you'll find the web documentation especially useful because it splits the functions up by type: <https://shiny.posit.co/r/reference/shiny/latest/> --- ## UI hierarchy Pages `\(\supset\)` Layouts `\(\supset\)` Panels `\(\supset\)` Inputs/Outputs <br> - Pages - Just 1 per UI - Define overall page structure - Layouts & panels - Can seem somewhat interchangeable - Define how to place the arguments given to them on the page - Layouts can have complex structure - Panels often define the look of the added item - Inputs/Outputs - Create the visible content of the page - Enable user to interact with your app - Provide placeholders you can programmatically update --- ## UI Pages (I) - `fluidPage()` ... mostly use this! Every item passed to it is just placed straight on the page and wrapped where necessary -- Make super simple apps if you want to explore how any element works: ``` r ui <- fluidPage( "One", "Two", "Three" ) shinyApp(ui, server = function(input, output, session) {}) ``` **Demo:** above, plus replicating to observe wrap --- ## UI Pages (II) More complex options: - `navbarPage()` ... quite useful for having multiple apps on a single page, creates tabbed environment - first argument is title - 1+ more arguments are calls to `tabPanel()` for each tabbed panel, eg ``` r ui <- navbarPage( "Title of page", tabPanel("My first tab", "Hello Alice"), tabPanel("My second tab", "Hello Bob") ) shinyApp(ui, server = function(input, output, session) {}) ``` Other page layout options: `fixedPage()`, `fillPage()` (see docs) --- ## UI Layouts/Panels : `titlePanel` - `titlePanel()` ... creates full width title ``` r ui <- fluidPage( titlePanel("My App"), "One", "Two", "Three" ) shinyApp(ui, server = function(input, output, session) {}) ``` --- ## UI Layouts/Panels : `sidebarLayout` and friends - `sidebarLayout()` ... creates a sidebar with styling, usually for inputs in sidebar and outputs in main area - `sidebarPanel()` first argument, to set left menu - `mainPanel()` second argument, to set body of output ``` r ui <- fluidPage( titlePanel("My App"), * sidebarLayout( * sidebarPanel("I'm in sidebar"), * mainPanel("I'm in main panel") * ) ) shinyApp(ui, server = function(input, output, session) {}) ``` --- ## UI Layouts/Panels : `sidebarLayout` and friends More complex options: - `fluidRow()` ... defines a new row containing: - `column()` calls - first a number 1-12 (sum of all columns must be 12), indicating how much width to take up - second+ arguments are outputs ``` r ui <- fluidPage( fluidRow( column(4, "Lorem ipsum dolor sit amet, consectetur adipiscing elit, sed do eiusmod tempor incididunt ut labore et dolore magna aliqua. Ut enim ad minim veniam, quis nostrud exercitation ullamco laboris nisi ut aliquip ex ea commodo consequat. Duis aute irure dolor in reprehenderit in voluptate velit esse cillum dolore eu fugiat nulla pariatur. Excepteur sint occaecat cupidatat non proident, sunt in culpa qui officia deserunt mollit anim id est laborum."), column(8, "Lorem ipsum dolor sit amet, consectetur adipiscing elit, sed do eiusmod tempor incididunt ut labore et dolore magna aliqua. Ut enim ad minim veniam, quis nostrud exercitation ullamco laboris nisi ut aliquip ex ea commodo consequat. Duis aute irure dolor in reprehenderit in voluptate velit esse cillum dolore eu fugiat nulla pariatur. Excepteur sint occaecat cupidatat non proident, sunt in culpa qui officia deserunt mollit anim id est laborum.") ), fluidRow( column(6, "Lorem ipsum dolor sit amet, consectetur adipiscing elit, sed do eiusmod tempor incididunt ut labore et dolore magna aliqua. Ut enim ad minim veniam, quis nostrud exercitation ullamco laboris nisi ut aliquip ex ea commodo consequat. Duis aute irure dolor in reprehenderit in voluptate velit esse cillum dolore eu fugiat nulla pariatur. Excepteur sint occaecat cupidatat non proident, sunt in culpa qui officia deserunt mollit anim id est laborum."), column(6, "Lorem ipsum dolor sit amet, consectetur adipiscing elit, sed do eiusmod tempor incididunt ut labore et dolore magna aliqua. Ut enim ad minim veniam, quis nostrud exercitation ullamco laboris nisi ut aliquip ex ea commodo consequat. Duis aute irure dolor in reprehenderit in voluptate velit esse cillum dolore eu fugiat nulla pariatur. Excepteur sint occaecat cupidatat non proident, sunt in culpa qui officia deserunt mollit anim id est laborum.") ) ) shinyApp(ui, server = function(input, output, session) {}) ``` ---  Image from "Mastering Shiny", by H. Wickham Free online: [https://mastering-shiny.org/](https://mastering-shiny.org/) --- class: inverse ## And many more ... ... than there is time to cover in lectures ⏳ <br> See the "UI Layout" section of the documentation: <https://shiny.posit.co/r/reference/shiny/latest/> --- ## UI Inputs Inputs are how you allow the user to interact with the app. **Important:** all inputs take *same* first argument: - `inputId` ... this is the name you will use to get the value later (so must be unique!) - access is via `input$name` where `name` is the `inputId` you gave the input (Many inputs also take a `label` for which you can give a human readable description) --- ## UI Inputs : text To allow typing any text: - `textInput()` - single line text input - `passwordInput()` - hides the input text on screen - `textAreaInput()` - allows multiline inputs <br> ``` r ui <- fluidPage( textInput("name", "What's your name?"), passwordInput("password", "What's your password?"), textAreaInput("story", "Tell me about yourself", rows = 3) ) shinyApp(ui, server = function(input, output, session) {}) ``` --- ## UI Inputs : numeric To input numeric values: - `numericInput()` - type the number directly - `sliderInput()` - to drag to choose a number - can choose a range too (vector of two values) <br> ``` r ui <- fluidPage( numericInput("num", "Number one", value = 0, min = 0, max = 100), sliderInput("num2", "Number two", value = 50, min = 0, max = 100), sliderInput("rng", "Range", value = c(10, 20), min = 0, max = 100) ) shinyApp(ui, server = function(input, output, session) {}) ``` --- ## UI Inputs : categorical To input (fixed, predetermined) categorical values: - `selectInput()` - drop down list - single selection default (`multiple = TRUE` for more) - `radioButtons()` - single selection radio buttons - see also `choiceNames` and `choiceValues` arguments in docs - `checkboxGroupInput()` - multiple selection checkboxes - see `checkboxInput()` for single ``` r animals <- c("dog", "cat", "mouse", "bird", "other", "I hate animals") ui <- fluidPage( selectInput("state", "What's your favourite state?", state.name), radioButtons("animal", "What's your favourite animal?", animals), checkboxGroupInput("animal2", "What animals do you like?", animals) ) shinyApp(ui, server = function(input, output, session) {}) ``` --- class: inverse ## UI Inputs : many more ... ... than there is time to cover in lectures ⏳ - Dates - File uploads - Buttons - ... <br> See the "UI Inputs" section of the documentation: <https://shiny.posit.co/r/reference/shiny/latest/> --- ## UI Outputs & the Server Outputs are how you feed back to the user updates based on their interaction with the app. **Important:** all outputs also take *same* first argument: - `outputId` ... this is the name you will use to render to the output later (so must be unique!) - output is via `output$name` where `name` is the `outputId` you chose -- But, what goes *in* an output is determined by the "server" function which we've ignored until now. ``` r ui <- fluidPage( ) server <- function(input, output, session) { * # Server code here } shinyApp(ui, server) ``` This gets re-run *every* time some input changes --- ## UI Outputs : text - `textOutput()` and `renderText()` - `verbatimTextOutput()` and `renderPrint()` ``` r ui <- fluidPage( textInput("name", "What's your name?"), textOutput("greet") ) server <- function(input, output, session) { output$greet <- renderText({ if(nchar(input$name) > 0) { return(paste0("Hello ", input$name)) } else { return("Hello friend, tell me your name!") } }) } shinyApp(ui, server) ``` --- ## UI Outputs : plots - `plotOutput()` and `renderPlot()` - argument `res = 96` is recommended if you want the plot to look as close in scale to what you see in RStudio. ``` r ui <- fluidPage( plotOutput("myplot", width = "400px") ) server <- function(input, output, session) { output$myplot <- renderPlot({ plot(iris$Sepal.Length, iris$Sepal.Width) }, res = 96) } shinyApp(ui, server) ``` --- .smaller[ ``` r library("shiny") library("ggplot2") ui <- fluidPage( sidebarLayout( sidebarPanel( textInput("name", "What's your name?"), selectInput("xvar", "What is the x variable?", names(iris), selected = names(iris)[2]), selectInput("yvar", "What is the y variable?", names(iris), selected = names(iris)[1]), ), mainPanel( textOutput("greet"), plotOutput("myplot", width = "400px") ) ) ) server <- function(input, output, session) { output$greet <- renderText({ if(nchar(input$name) > 0) { return(paste0("Hello ", input$name, ", here is your plot ...")) } else { return("Hello friend, tell me your name!") } }) output$myplot <- renderPlot({ if(nchar(input$name) > 0) { ggplot(iris, aes_string(x = input$xvar, y = input$yvar)) + geom_point() + labs(title = paste0(input$name, "'s plot!")) } }, res = 96) } shinyApp(ui, server) ``` ] --- ## Variables outside outputs If you need to calculate something which will be used in *multiple* outputs, you may want to put it outside the `output` block. -- eg, can we do ... ? **NO** ... Shiny uses *reactive programming* ``` r server <- function(input, output, session) { * name <- toupper(input$name) output$greet <- renderText({ if(nchar(input$name) > 0) { * return(paste0("Hello ", name, ", here is your plot ...")) } else { return("Hello friend, tell me your name!") } }) output$myplot <- renderPlot({ if(nchar(input$name) > 0) { ggplot(iris, aes_string(x = input$xvar, y = input$yvar)) + geom_point() + * labs(title = paste0(name, "'s plot!")) } }, res = 96) } ``` --- You need to wrap any calculations in `reactive()` and then access those new variables like a function! ``` r server <- function(input, output, session) { * name <- reactive({ * toupper(input$name) * }) output$greet <- renderText({ if(nchar(input$name) > 0) { * return(paste0("Hello ", name(), ", here is your plot ...")) } else { return("Hello friend, tell me your name!") } }) output$myplot <- renderPlot({ if(nchar(input$name) > 0) { ggplot(iris, aes_string(x = input$xvar, y = input$yvar)) + geom_point() + * labs(title = paste0(name(), "'s plot!")) } }, res = 96) } ``` Shiny will auto-detect when name changes and *only* recalculate `name` in that case. Similarly, the `greet` output is *not* updated if only `xvar` or `yvar` change! --- .smaller[ ``` r library("shiny") library("ggplot2") ui <- fluidPage( sidebarLayout( sidebarPanel( textInput("name", "What's your name?"), selectInput("xvar", "What is the x variable?", names(iris), selected = names(iris)[2]), selectInput("yvar", "What is the y variable?", names(iris), selected = names(iris)[1]), ), mainPanel( textOutput("greet"), plotOutput("myplot", width = "400px") ) ) ) server <- function(input, output, session) { name <- reactive({ toupper(input$name) }) output$greet <- renderText({ if(nchar(input$name) > 0) { return(paste0("Hello ", name(), ", here is your plot ...")) } else { return("Hello friend, tell me your name!") } }) output$myplot <- renderPlot({ if(nchar(input$name) > 0) { ggplot(iris, aes_string(x = input$xvar, y = input$yvar)) + geom_point() + labs(title = paste0(name(), "'s plot!")) } }, res = 96) } shinyApp(ui, server) ``` ] --- ## Going further ... Mastering Shiny, by Hadley Wickham <https://mastering-shiny.org/> <br> Hosting online (free up to 5 apps) <https://www.shinyapps.io/>